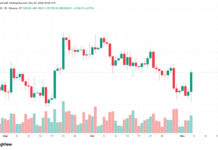
- The RAY price has rebounded sharply and now sits at a resistance zone that capped it during the late-October slide.
- Tokenized stocks generated more of Raydium’s swap revenue than memecoins for a third straight month.
- The death cross on the four-hour chart remains in place despite the rally.
- Momentum readings suggest the move is stretched in the short term.
The RAY price has gained roughly 20% from Wednesday’s low of $1.48 and traded near $1.79 on Thursday morning, putting Raydium’s token directly against the $1.78 area where the 200-period exponential moving average (EMA) meets the midpoint of its late-October decline. The rebound lines up with fresh Blockworks Research data showing that tokenized equities produced 39% of Raydium’s swap revenue in October, ahead of memecoins at 32%. Stock-linked tokens have now led the Solana exchange’s fee growth for three months in a row, a sharp turn for a protocol that earned most of its income from meme trading at the start of the year.
A 20% Bounce Meets the $1.78 Ceiling
The move came after a three-week slide. RAY peaked at $2.09 on October 21, then lost almost 30% over the following two weeks, and around October 24 the 50-period EMA crossed below the 200-period EMA. Traders call this a death cross, and it usually marks the point where a pullback turns into a downtrend.

The recovery candles on November 4 printed the heaviest buying volume since the October 29-30 sell-off. That matters because thin-volume rebounds tend to fade quickly. In the process, RAY reclaimed its 50-period EMA at $1.6688, which means the price is now above its average of roughly the last eight days. The 50 EMA still sits below the 200 EMA, though, so the death cross has not been undone and the longer trend on this timeframe still points down.
The current test is unusually tight. The 200-period EMA is at $1.7831 and the 0.5 Fibonacci retracement, the halfway point between the $2.09 high and the $1.48 low, is at $1.7844. Sellers have two reasons to step in at almost exactly the same price.
| Level | Price | Why it matters |
|---|---|---|
| 0.618 Fibonacci | $1.8558 | First target after a breakout |
| 200 EMA / 0.5 Fib | $1.7831-$1.7844 | Resistance being tested now |
| 0.382 Fibonacci | $1.7129 | First support on a pullback |
| 50 EMA | $1.6688 | Short-term trend line |
A four-hour close above $1.7844 would open the way to $1.8558, with $1.9576 above that. If the zone rejects the price, $1.7129 is the first support and the 50 EMA comes next. Below $1.6244, the rebound would lose most of its structure.
Momentum Is Running Hot
The Relative Strength Index (RSI) on the four-hour chart has reached 70.66, while its signal average stands at 52.47. A reading above 70 means buyers have controlled almost every candle over the past two and a half days, and the gap to the average shows how quickly that happened: on November 3 the RSI was near 28, deep in oversold territory. Readings this stretched often lead to a pause or a shallow pullback while the price digests the move, even when the broader recovery stays intact.
Why Stock Tokens Pay Raydium More Than Memecoins
The fee data gives the rally a fundamental backdrop, even if traders did not necessarily buy on it. Tokenized assets, blockchain tokens that track the price of US-listed shares such as Tesla or Nvidia, accounted for about 20% of Raydium’s trading volume in the third quarter but roughly 45% of its swap fees, based on the Q3 report figures. The most likely explanation is pricing. Stock-token pools are less liquid than SOL-stablecoin pairs and they keep trading after Wall Street closes, so liquidity providers can charge higher fee tiers and traders still accept the cost.
| Pair category | October share | Trend since January |
|---|---|---|
| Tokenized assets | 39% | Up from a few percent |
| Memecoins | 32% | Down from about two-thirds |
| Project tokens | 18% | Rising |
| SOL-stablecoin | 6% | Down from about a quarter |
Source: Blockworks Research
StonkFun added the second piece. The launchpad pairs new tokens against tokenized stocks instead of SOL, and it moved all of its launches to Raydium’s LaunchLab on September 5. Every trade in those new tokens therefore runs through a stock pair. According to the Raydium Q3 2026 tokenholder report, StonkFun generated about 86% of LaunchLab’s platform-attributed protocol fees. Net revenue for the quarter reached $7.99 million, up 264.2% from $2.19 million in Q2, and September alone brought in $6.06 million. Reactor Labs, Raydium’s developer, funded the report, although Blockworks Advisory says it keeps editorial control.
Buybacks Now Track a Different Kind of Trader
Raydium spent $5.23 million buying back RAY in the third quarter, and those purchases depend directly on fee income. A revenue base built on stock tokens follows US equity sentiment and after-hours trading demand more closely than Solana meme cycles, which in the past produced sharp spikes followed by long droughts. That could make buyback flows steadier over time. It also creates a new dependency, because if StonkFun launches fewer tokens or its users trade less often, a large share of LaunchLab fees goes with it.
Liquidity also moved in the opposite direction from fees during October. Total value locked on Raydium fell from $1.35 billion on October 6 to $1.085 billion by month-end, according to DefiLlama data, so the shift in the fee mix happened while less capital sat in Raydium’s pools.
Raydium still handles more stock-token trading than any other Solana exchange, although its lead narrowed last month. It captured 38% of spot tokenized asset volume on Solana in October, according to Blockworks Research, compared with 49.8% across the third quarter as a whole. Orca took 15% and Meteora 11%, while smaller venues such as Manifest, ZeroFi and GoonFi collected much of the rest, competing for the same high-fee flow that now drives Raydium’s revenue.

Raydium says the any-token-pair model that made StonkFun possible will bring additional launch partners in the coming quarters, and its fourth-quarter tokenholder report, expected around late January, will show whether stock tokens held their lead through November and December or whether October marked the high point of the shift.