
 Rival Might Be the Next Meme Coin to Explode – Here’s Why")
 Bulls Eye New All-Time High: Potential Surge Beyond $260 in Sight?")


Bitcoin recently experienced a huge influx of new addresses being created on its network even as its price continued to decline, according to data analyzed by crypto market expert Ali Martinez.
Martinez found that over 717,000 new Bitcoin addresses were generated on September 9, marking the largest single-day surge in new wallet addresses for the cryptocurrency in five years. The last time Bitcoin saw over 700,000 new addresses created in one day was back in December 2017.
Given this insight, what are the biggest crypto gainers today on DEXTools?
This spike comes as Bitcoin’s price has fallen over 14% in the last month, now sitting around $25,100 as of writing.
The world’s largest cryptocurrency by market capitalization has been caught in bearish sentiment along with the overall crypto market amid regulatory concerns, the strengthening of the U.S. dollar, and other macroeconomic factors.
Some analysts view the rapid growth in new Bitcoin addresses as a bullish sign, suggesting increased interest in accumulating the cryptocurrency at lower price levels.
However, others caution that continued price weakness could persist in the near term based on Bitcoin’s bearish technical indicators.
While short-term price action remains uncertain and volatile, Bitcoin has still seen strong gains of nearly 55% so far in 2023.
The recent address growth will likely draw attention from market observers as a potential leading indicator of renewed momentum, though ongoing macro conditions make Bitcoin’s path forward unclear.
With Bitcoin trading slightly lower with a loss of 2.82% so far today at $25,108, market participants are seeking more significant gains in lesser-known cryptocurrencies.
EMOTI, YAMA, and BOOST are spiking as some of the biggest crypto gainers today on DEXTools, contrasting the bearish performance of Bitcoin and the broader cryptocurrency market.
EmotiCoin (EMOTI) Surges to New Heights
EmotiCoin (EMOTI) has seen tremendous growth recently, increasing 1,695,078.73% so far for the past week. While some pullback has occurred, the overall upward price trend continues at an impressive pace.
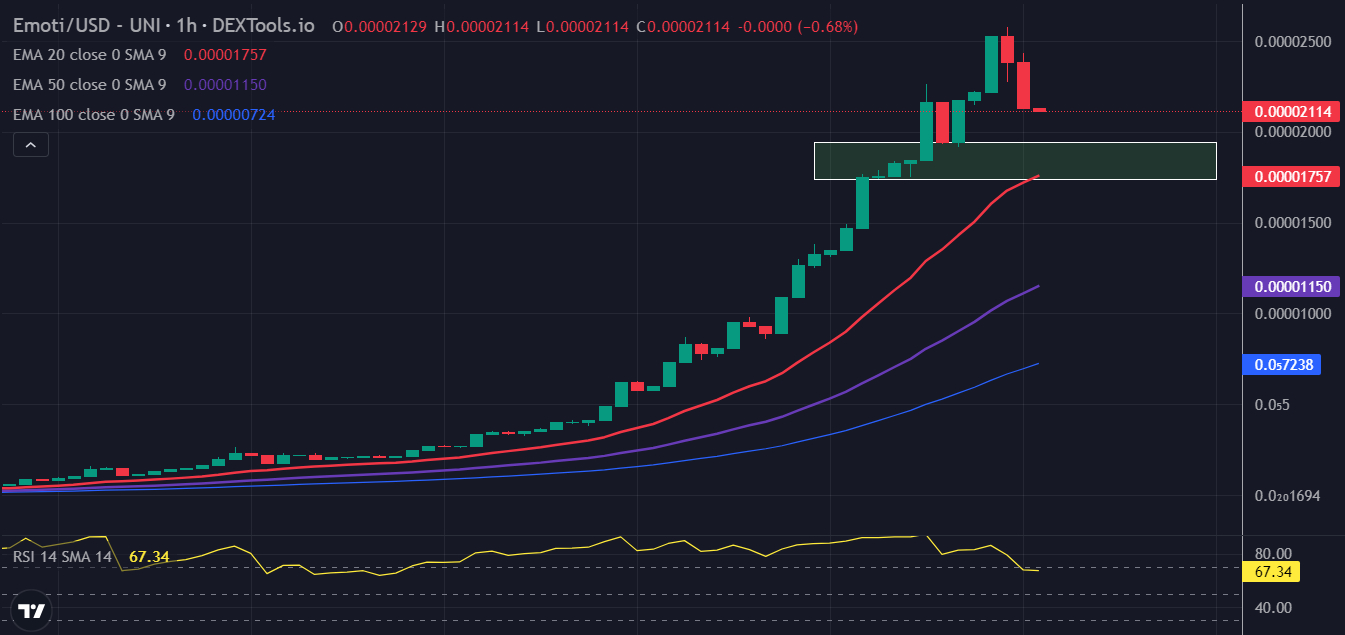
The Exponential Moving Averages (EMAs) paint a bullish picture for EmotiCoin. The 1-hour 20-EMA stands at $0.00001757, the 50 EMA at $0.00001150, and the 100 EMA at $0.000007238.
This suggests that the cryptocurrency is trading well above its average prices, indicating a strong bullish trend. If the coin were to experience a much deeper pullback, these EMAs could potentially provide support and prevent further downward movement.
EMOTI’s RSI is currently at 67.34, down from an intraday high of 94.63. This suggests that the cryptocurrency is experiencing a healthy retracement or, in simpler terms, a temporary slowing down of its rapid price increase.
Traders can anticipate a bounce between RSI 50 to RSI 60, signaling a potential buying opportunity for those looking to enter the market.
The current price of EmotiCoin stands at $0.00002114, marking a price movement of 241.51% so far today. Despite the bullish trend, traders should remain mindful of EmotiCoin’s resistance and support levels.
The cryptocurrency is currently facing a swing high resistance zone between $0.00002384 and $0.00002576. This range indicates a level where the selling pressure may overcome the buying pressure, potentially hindering the price from rising further.
EmotiCoin also has an immediate horizontal support zone between $0.00001736 and $0.00001944. This range represents a level where buying pressure may overcome selling pressure, potentially preventing the price from falling further.
The technical indicators suggest that EmotiCoin’s bullish momentum is likely to persist in the near term, albeit with potential retracements. Traders should closely monitor the RSI levels for buying opportunities and keep an eye on the resistance and support zones.
Deciphering YAMA’s Potential Hourly Symmetrical Triangle Pattern Formation
Traders were given whiplash today as YAMA catapulted over 112% out of the gate only to pare back gains and slide into a symmetrical triangle pattern when the rally ran out of momentum.
With the market at a tipping point, analysts are closely monitoring key levels and technical indicators to determine YAMA’s next probable swing.
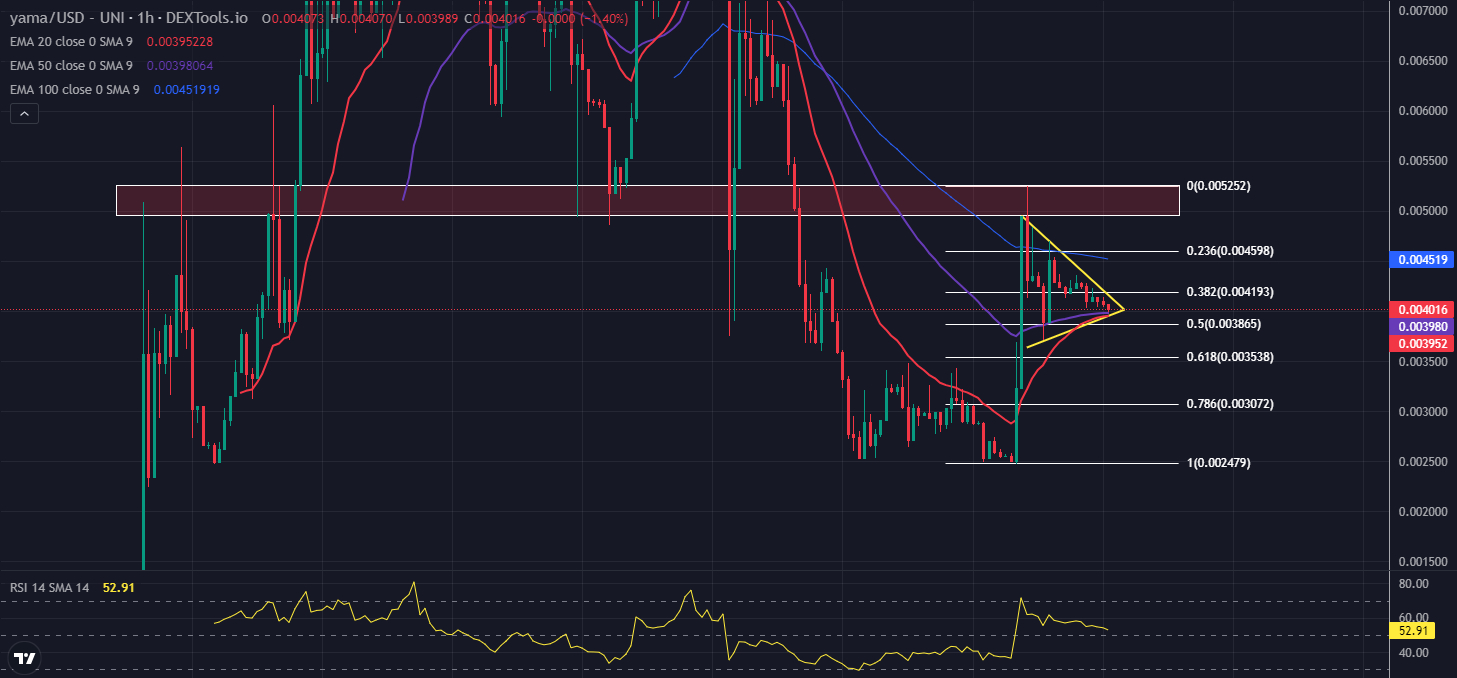
Looking at the 1-hour technical indicators, several points stand out. YAMA’s 20 EMA is at $0.0003952, while the 50 EMA is slightly higher at $0.0003980. Interestingly, the 100 EMA is much higher at $0.004519. Such a significant gap indicates a considerable price fluctuation, highlighting the potential for volatility in the short term.
Meanwhile, the RSI is currently at 52.91. This position is right in the middle of the scale, suggesting a balance between buying and selling pressure.
Despite the retracement, YAMA is currently trading at $0.004016, still showing a significant gain of 40.58% so far today. On the resistance side, the symmetrical triangle has an upper descending trendline at $0.004156. This is closely followed by the Fib 0.382 level at $0.004193.
If YAMA successfully breaks these levels and confirms a bullish move, a rise to the next resistance—the Fib 0.236 level at $0.004598—could occur. This is in line with the 1-hour 100 EMA at $0.004519.
In terms of immediate support, watch the 1-hour 20 and 50 EMAs at $0.0003952 and $0.0003980. Should a bearish move be confirmed and YAMA’s price fall below the symmetrical triangle pattern, a retest of the Fib 0.5 level at $0.003865 might be on the cards. A deeper pullback towards the Fib 0.618 level at $0.003538 is also possible.
Given these technical indicators, market participants should be cautious and monitor these levels closely. While the symmetrical triangle formation may suggest that a breakout is imminent, the direction of the move is not yet clear.
The close alignment of the EMAs and the neutral RSI does not provide a strong bias either way. Keep an eye on the resistance and support levels mentioned for potential clues on YAMA’s next moves.
Navigating Uncertainty: Volatility and Potential Trends for Boost Coin (BOOST)
After posting gains of more than 50%, Boost Coin (BOOST) is experiencing some profit-taking that brought prices back down while still trading up by a respectable 17.71% so far today. As BOOST pulls back from its move, technical levels suggest the correction may be short-lived.
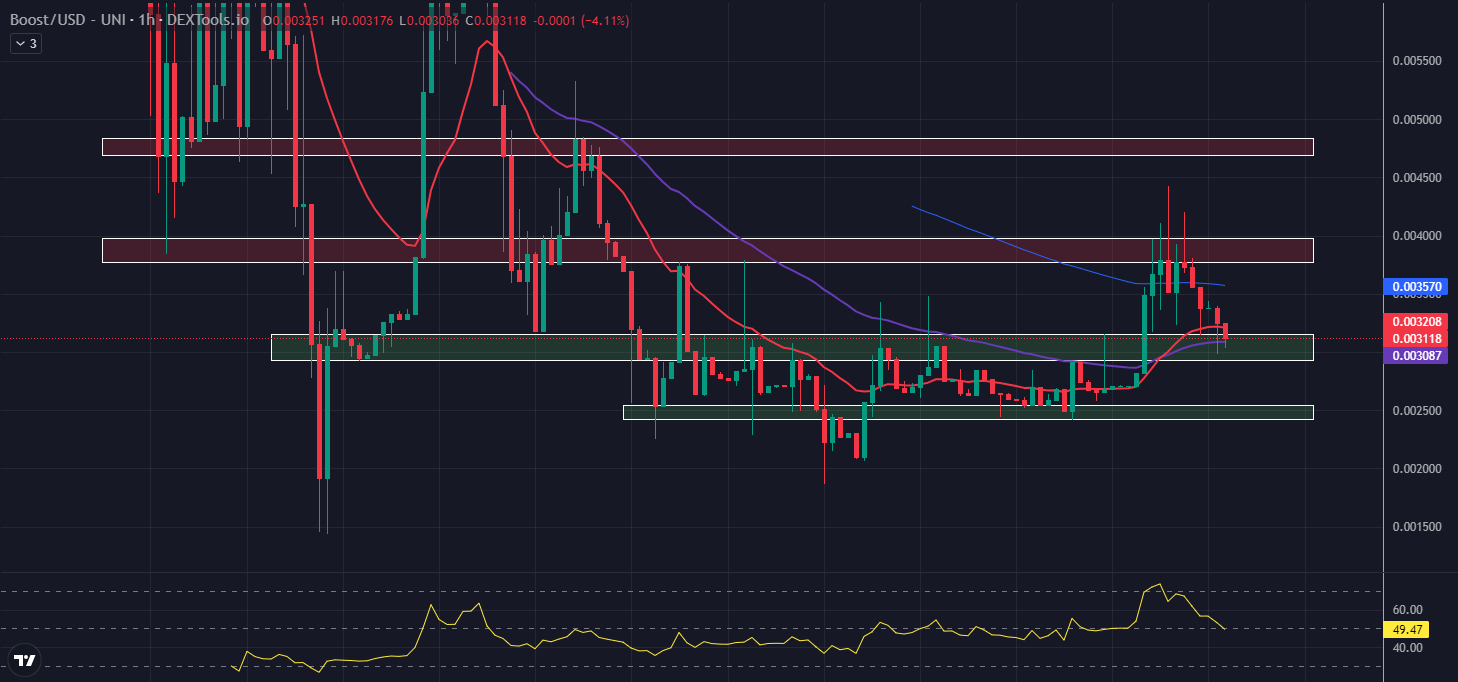
The EMAs of BOOST offer a mixed picture. The 20-EMA at $0.003208 is currently above the coin’s trading price, indicating a short-term bearish trend.
However, the 50-EMA at $0.003087 is still beneath the current price, suggesting a potential bullish scenario in the medium term.
The 100-EMA at $0.003570, well above the current price, signals that the long-term trend could be bearish. These mixed signals suggest a period of uncertainty and potential volatility.
The RSI of BOOST stands at 49.47, having slid from an intraday high of 73.71. A further slide below the RSI 50 level could potentially push BOOST into bearish territory. Traders should be cautious here as a falling RSI might indicate a further downtrend.
The current swing high resistance zone for BOOST ranges from $0.003768 to $0.003976. If BOOST can successfully remount this level, the next resistance zone is between $0.004684 to $0.004838. This could signal a return to a bullish trend.
On the downside, the immediate support stands at the 1-hour 50-EMA of $0.003087. This level coincides with the current support zone of $0.002925 to $0.003155. If BOOST fails to hold these levels, it could slide towards the next support zone, ranging from $0.002416 to $0.002543.
While BOOST has experienced a retracement, the technical indicators present a mixed picture. Investors should watch the RSI closely for potential signs of a further downtrend, while also keeping an eye on the resistance and support levels.
A break above the immediate resistance could signal a buying opportunity, while a slide below the immediate support might suggest a higher-risk scenario.
Overlooked Cryptocurrencies Worth Considering
Cryptocurrency presales can offer unique windows into promising projects before they become available to the broader crypto market. For investors seeking different avenues for their portfolio, crypto presales might present an exciting opportunity.
Buying into a project before its public launch can provide certain advantages, including lower token prices and the possibility of increased value if the initiative succeeds post-launch.
The presale stage usually comes with a reduced cost per token, which could rise substantially if the project gains traction after going public.
While participating in crypto presales comes with potential rewards, it also involves inherent risks that investors should weigh carefully.
The key to success primarily lies in identifying projects with strong leadership teams and well-conceptualized blockchain initiatives. However, performing thorough due diligence is necessary before committing any funds.
The analysts at Cryptonews.com use rigorous methodologies to evaluate upcoming cryptocurrency presales. They look at critical factors like the quality of the management team and the uniqueness of the project’s central ideas.
After a comprehensive analysis, they have highlighted select presales for 2023 as potentially appealing opportunities for those open to calculated financial risks.
The experts at Cryptonews.com underscore that putting funds into presales can cut both ways, especially in the traditionally volatile cryptocurrency market. Investors are encouraged to be judicious, focusing on initiatives with robust planning and leadership.
While financial rewards may not be guaranteed, thorough due diligence can help uncover emerging projects with promising foundations.
New Cryptocurrencies to Buy In 2023
Disclaimer: Crypto is a high-risk asset class. This article is provided for informational purposes and does not constitute investment advice. You could lose all of your capital.