


Major cryptocurrencies saw an increase in their prices in the final hours of trading yesterday, coinciding with the news of MicroStrategy Inc’s financial recovery in Q2.
Considering this latest development of the business intelligence giant reporting a substantial improvement in its financial status, what are the best cryptos to buy now?
In stark contrast to the net loss of $1.1 billion in the same quarter last year, MicroStrategy’s recent financial report shows a healthy net income of $22.2 million.
Despite total revenue remaining steady at around $120.4 million, the main driver of this turnaround was the sharp drop in losses related to cryptocurrencies.
These losses, which left a $917.8 million dent in the company’s balance sheet in Q2 2021, have now shrunk to just $24.1 million this quarter.
As outlined in its Tuesday filing, MicroStrategy plans to use the net earnings “for general corporate purposes, which may include the acquisition of bitcoin as well as the financing of our operations.”
These impairment losses occur when Bitcoin’s market price falls below MicroStrategy’s acquisition cost.
In Q2, Bitcoin fluctuated between $25,000 and $30,700 before surging in mid-June amid SEC filings for spot Bitcoin exchange-traded funds.
According to MicroStrategy CFO Andrew Kang, “Our bitcoin holdings increased to 152,800 bitcoins as of July 31, 2023, with the addition in the second quarter of 12,333 bitcoins being the largest increase in a single quarter since Q2 2021.”
Bitcoin is currently trading at $29,121, which reflects a 1.95% decrease so far today.
The cryptocurrency is currently retesting the Fib 0.382 level at $29,143 for support.
If it does not manage to maintain this level and closes below it, there is a possibility that Bitcoin may experience a further decrease and retest the 100-day EMA at $28,518.
Though Bitcoin’s price may be in a state of flux, the broader cryptocurrency market still offers promising prospects for those who know where to look.
Based on a combination of strong fundamentals and promising technical analysis, XDC Network, Wall Street Memes, Kaspa, XRP20, Maker, and Shibie are some of the best cryptos to buy now.
XDC Network (XDC): Bullish Resilience Shines Through, Up 38% in a Week
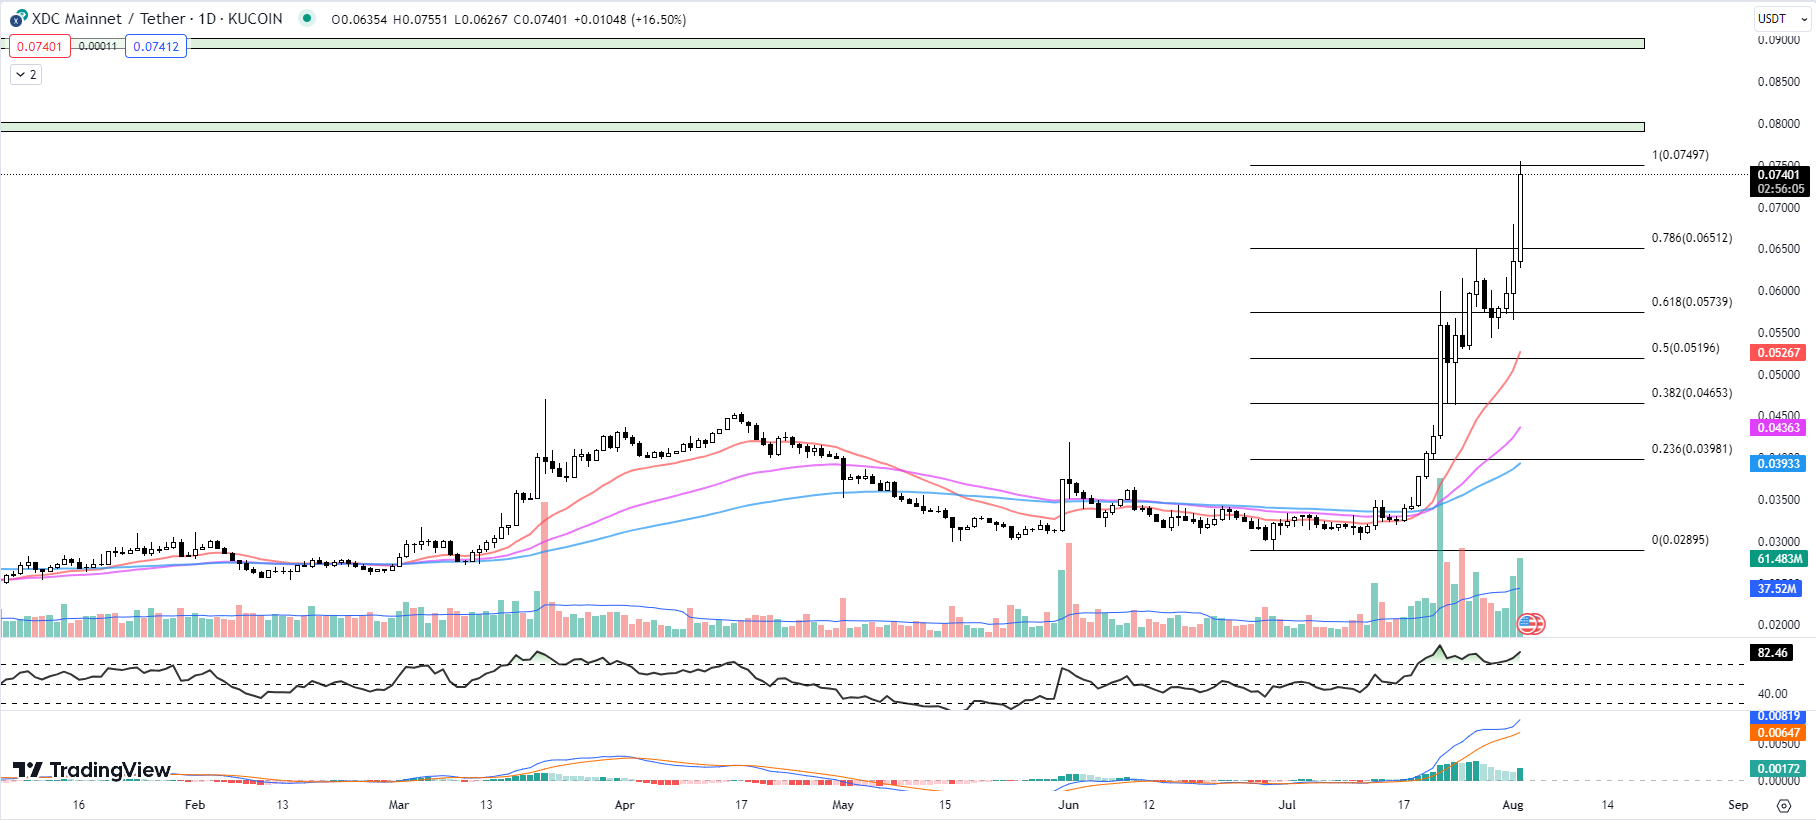
Despite already experiencing a substantial 38% price increase in the past week, XDC Network (XDC) continues to exhibit bullish resilience with four consecutive days of positive price action.
A detailed analysis of XDC’s key technical indicators may provide insightful direction for investors navigating this robust price movement.
Firstly, a look at the EMAs uncovers a compelling upward trend for XDC.
The 20-day EMA currently sits at $0.05267, well below the coin’s current price of $0.07401.
This signals a strong bull phase, as the shorter-term EMA sits above both the 50-day EMA at $0.04363 and the 100-day EMA at $0.03933.
When the shorter-term EMA surpasses the longer-term ones, it suggests that buyers are currently in control of the market.
The current bullish sentiment is reflected by the RSI, a momentum oscillator that measures the pace and extent of price movements.
The RSI currently stands at 82.46, up from yesterday’s 76.40, and has been above 70 for two consecutive weeks.
If the RSI climbs above 70, it may indicate that the stock is overbought, which could result in a correction in the short term.
However, in powerful uptrends, cryptocurrencies can remain overbought for an extended period.
The MACD histogram currently reads 0.00172, a significant increase from yesterday’s 0.00118, suggesting that upward momentum is increasing and that the bullish trend is gaining strength.
However, the path of least resistance for XDC seems to be facing an obstacle at the horizontal resistance zone of $0.07913 to $0.08015, a level not seen since January 2022.
This may pose a challenge for the bulls and could lead to a slight pullback or sideways movement in the short term.
In case of a potential retracement, the immediate support lies at the Fib 0.786 level at $0.06512.
This Fibonacci retracement level, often used by traders to anticipate areas of support or resistance, could act as a strong safety net for XDC’s price should the bullish momentum begin to wane.
While the bullish signals remain prominent for XDC, investors should remain vigilant.
The overbought RSI, coupled with the strong resistance level, may indicate a potential pullback or consolidation in the near future.
Traders are advised to closely monitor these levels and potentially consider protecting their profits or setting a stop-loss order to mitigate potential downside risk.
Whales Agree: Wall Street Memes Is One of the Best Cryptos to Buy Now
Wall Street Memes’ position in the cryptocurrency market has been further strengthened by a significant vote of confidence in the form of a $1 million investment from an anonymous investor during the $WSM presale.
This substantial investment, transacted in a series of five purchases amounting to 460 Ether (ETH), has thrust the project past its $20 million fundraising milestone.
The crypto community buzzed with speculation over this investor’s identity, with some even wondering whether tech tycoon Elon Musk might be behind the substantial investment.
Musk, who has shown interest in the Wall Street Memes community through social media interactions, has been known for his affinity for meme-themed tokens.
While the identity of the investor remains a mystery, the hefty transaction pushed the presale of the $WSM token past the $20 million threshold, nudging the project closer to its $30 million objective.
This has elevated the standing of Wall Street Memes in the online retail investing sphere, which is already distinguished by its influential community of more than a million followers across various social media platforms.
Riding the popularity of meme coins, the Wall Street Memes project, which originated from the 2021 retail investing movement, is gaining traction in the crypto market with the successful presale of its $WSM token.
This achievement highlights the growing influence of retail investors and Internet communities in the financial market.
However, Wall Street Memes is far from finished. They are ambitiously looking to raise additional funds via $WSM token sales in the final stages of the presale.
Some analysts predict that, based on the project’s robust community support and strong presale performance, $WSM could be one of the best meme coins to buy this year.
Kaspa (KAS) Enters Price Discovery Mode – Fibonacci Extensions Provide Clues for Next Targets
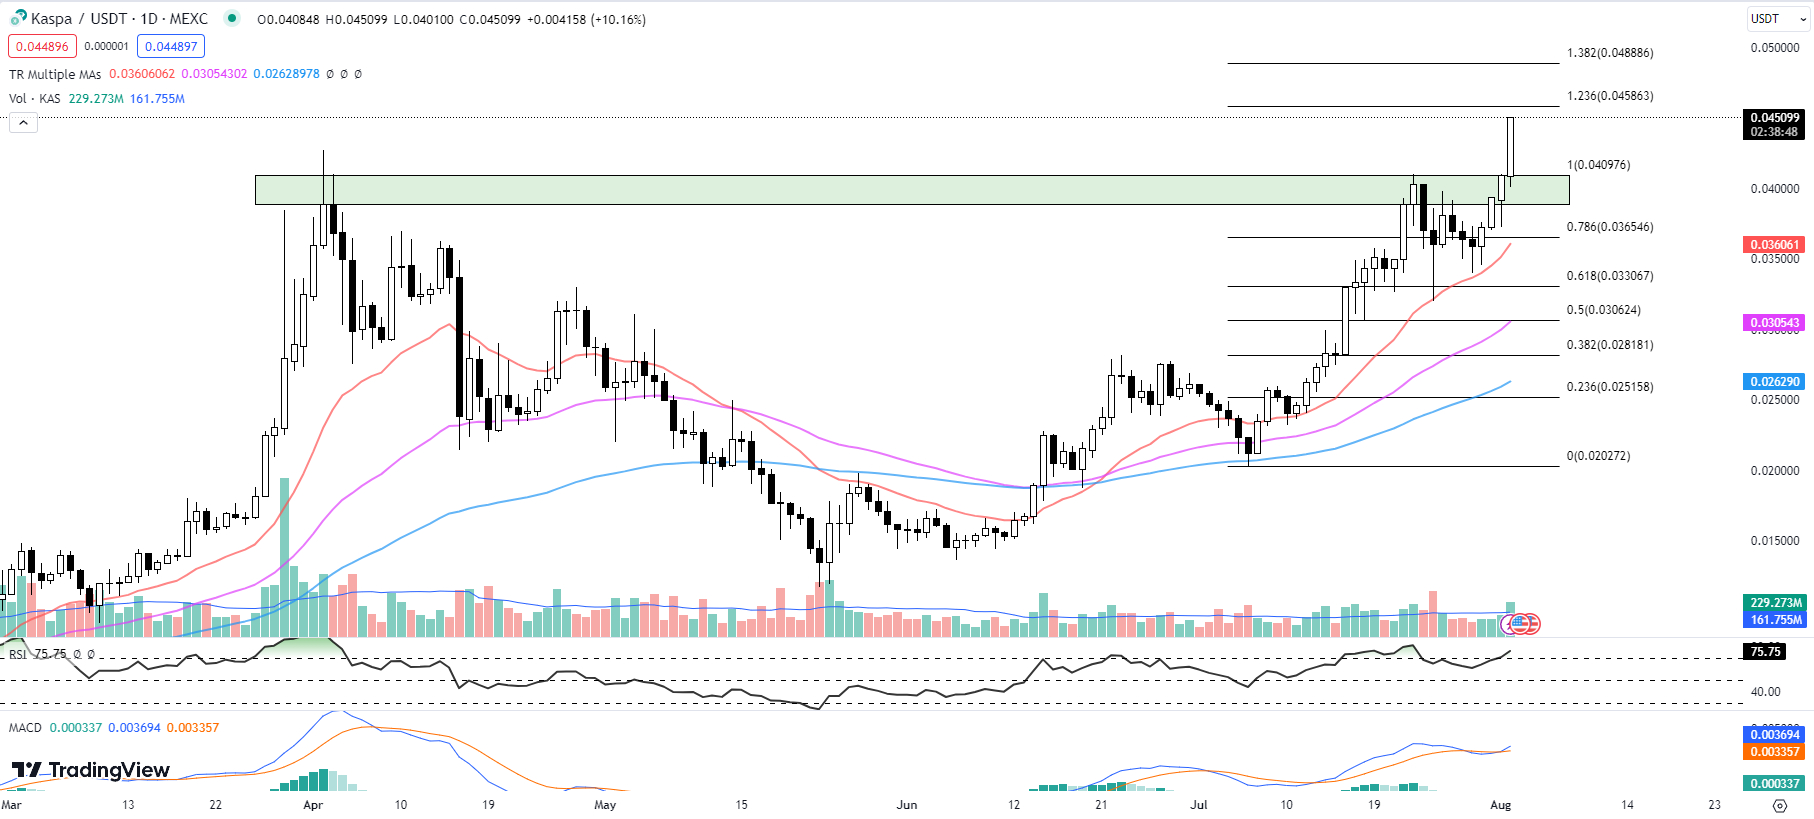
Kaspa (KAS) has been on a robust upward trajectory and is currently relishing its fourth consecutive day on the upside.
KAS set a new all-time high earlier today at $0.045340, adding an impressive 10.16% increase so far today.
As it steps into price discovery mode, the critical question on every trader’s mind is: what could be the next potential targets?
Looking at the technical indicators, we see a compelling bullish story unfold. The 20-day EMA, a widely watched trend indicator, currently sits at $0.036061, notably above the 50-day EMA of $0.030543 and the 100-day EMA of $0.026290.
This positioning of shorter-term EMAs above longer-term ones is indicative of positive price momentum, signaling a possible continuation of the uptrend.
Kaspa’s solid performance is further evidenced by the RSI, which surged from 70.23 to 75.75 within a day.
While an RSI reading above 70 usually indicates overbought levels and may signal a reversal, prolonged periods above this threshold are typically associated with robust uptrends, which is evident in KAS’ case.
Additionally, the MACD histogram shows an increase from yesterday’s 0.000025 to today’s 0.000337.
This ascending MACD histogram further bolsters the notion of the continuing bullish sentiment surrounding KAS.
But what should traders look for next? As KAS sets new highs, it’s venturing into the somewhat uncertain territory of price discovery.
Here, Fibonacci extensions can provide guidance. The extended Fib levels of 1.236 at $0.045863 and 1.382 level at $0.048886 may serve as the next potential targets.
These levels, derived from mathematical ratios found in nature and markets, have often provided reliable indications of support and resistance in price discovery scenarios.
While the bullish momentum is strong, traders must also consider potential support levels should a pullback occur.
The immediate support for KAS appears to lie in the horizontal resistance zone of $0.0388777 to $0.040976.
This range, once a hurdle, could now serve as a safety net for prices, acting as a cushion against any sudden downward price movement.
The technical indicators portray a confident bull market for Kaspa (KAS) with strong upward momentum.
Traders should eye the potential Fibonacci extension levels for new price targets while keeping a close watch on the immediate support zone for potential buy opportunities during pullbacks.
Why XRP20 is One of the Best Cryptos to Buy Now for Retail Investors
For retail investors seeking an affordable way to capitalize on Ripple’s victory against the SEC, the newly launched XRP20 token presents an intriguing option at a fraction of the price of XRP.
With major exchanges expected to relist XRP after the favorable ruling, XRP20 offers a way to gain similar exposure for just $0.00009200 per token.
Unlike its Ripple counterpart, XRP20 introduces staking rewards in a deflationary setting.
Of the total 100 billion XRP20 tokens, 40 billion are allocated for the presale and another 40 billion are committed to staking rewards.
The remaining 20 billion are split between DEX liquidity and a burn mechanism that will eventually reduce the total token count.
Post-DEX launch, a token-burning protocol will be put into effect, wherein 0.1% of each transaction will automatically be sent to a designated address.
This will effectively diminish the total number of tokens over time, potentially increasing the value of each remaining token.
The plan for XRP20 is rolled out in four stages. Stage one revolves around the presale and token distribution. Stage two seeks to boost the token’s accessibility and usability.
Following the launch, stage three commences with the implementation of the token burning mechanism, of which 0.1% of every transaction goes to a burn address, while 10% of the supply is allocated to burn.
The final stage will delve into the community staking post-launch. Dates for these stages are yet to be announced.
As Ripple gears up for major developments, investors can take advantage of XRP20’s low price point to get in on the action.
Maker (MKR) Hits a New Year-To-Date High, but Corrective Pullback May Be In Sight
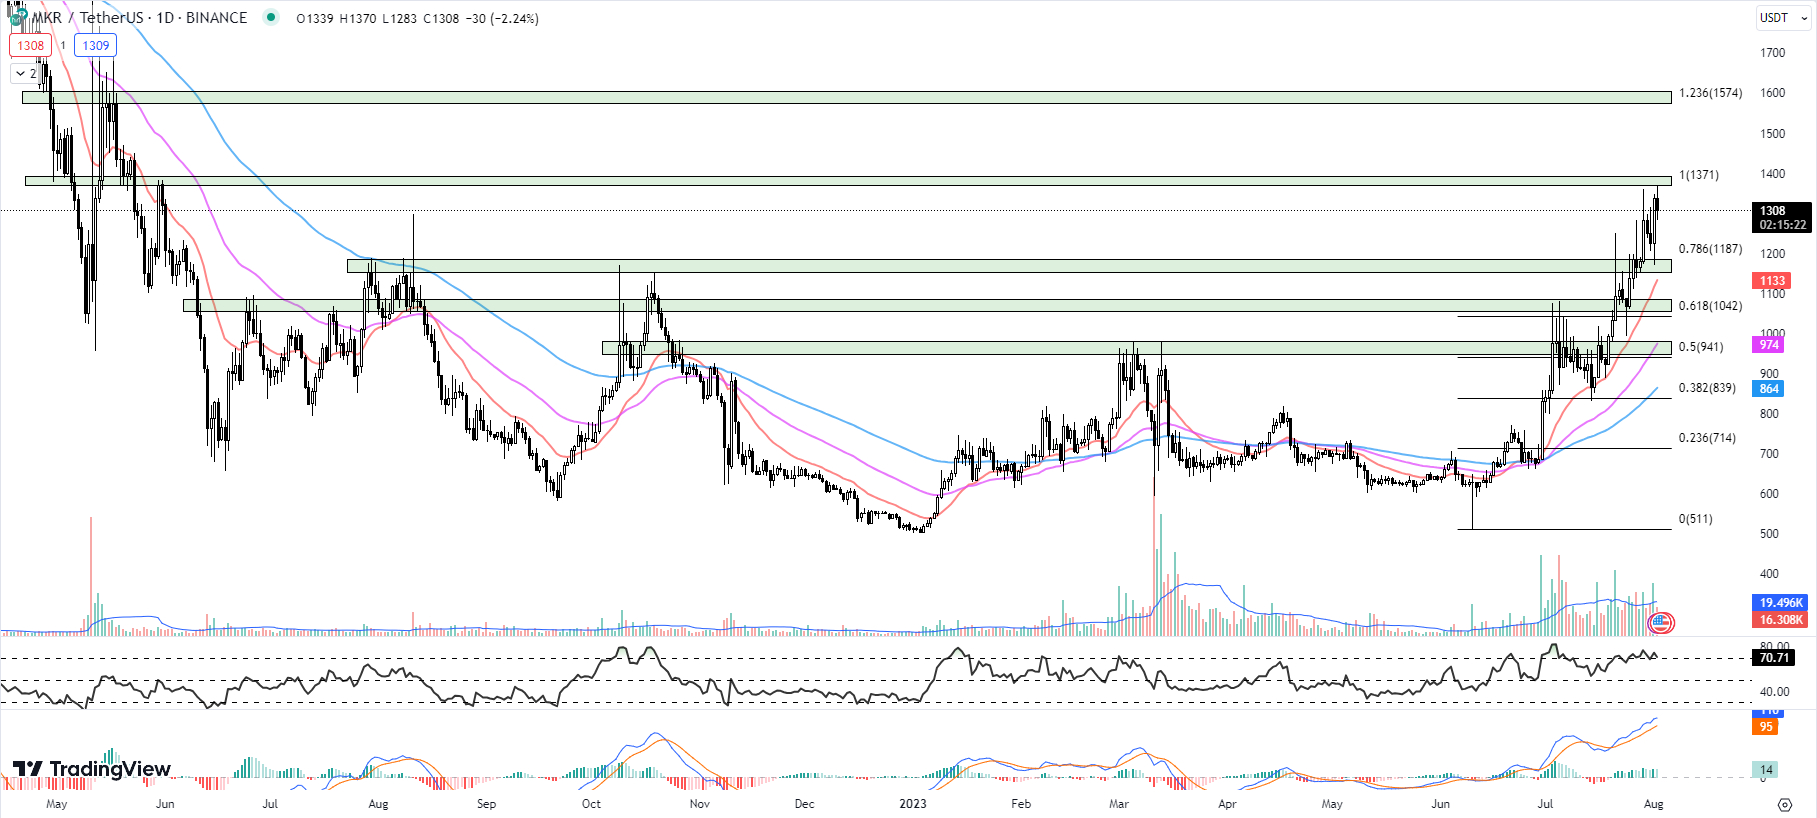
Maker (MKR) has seen a 52% increase in price over the past month and recently reached a new year-to-date high at $1,370 earlier today.
This upward momentum, however, was cut short as prices dropped to the current level of $1,308, marking a 2.24% dip so far today.
Notably, the MKR’s 20-day EMA is at $1,133, well below the current price. The 50-day and 100-day EMAs are also trailing at $974 and $864, respectively.
The significant margin between these averages and the current price underscores the strong upward trend MKR has been experiencing. However, a closer observation reveals the possibility of a corrective pullback.
The RSI has slightly decreased from 74.56 to 70.71. Typically, an RSI above 70 indicates overbought conditions and might suggest a potential trend reversal or a period of consolidation.
Investors are advised to monitor this indicator as a further drop could signify a potential decrease in buying pressure.
The MACD histogram also displays a reduction from 16 to 14. Although still in the positive territory, indicating bullish momentum, the shrinking histogram could be an early indication of slowing upward momentum.
Analyzing the price structure, MKR currently faces a significant horizontal resistance zone from $1,371 to $1,393, last seen in May 2022.
If MKR can breach this resistance level, traders might expect the next target at the extended Fib 1.236 level of $1,574.
However, given the decreasing RSI and MACD, it may be an uphill battle to reach this level without a period of consolidation or minor pullback.
On the downside, the immediate support lies at the Fib 0.786 level of $1,187, which is in confluence with the horizontal support zone of $1,153 to $1,186.
Should the price pullback deepen, investors will want to see if these levels can hold to maintain the overall bullish trend.
While the technical indicators do highlight a strong uptrend for MKR, they also suggest possible cooling off in the short term.
Investors should be cautious and potentially prepare for a brief consolidation phase before the next substantial move.
A decisive break above the resistance or below the support should provide further clarity about MKR’s immediate future trajectory.
Shibie Coin: Blending Pop Culture with Crypto
Shibie Coin is shaking up the meme coin market with the recent launch of its native token, $SHIBIE, now available for presale.
The coin’s name is a nod to the convergence of the Shiba Inu dog meme and Barbie, and Shibie Coin is set to appeal to a community of digital-savvy enthusiasts.
Shibie’s strengths lie in its focus on community-building, a strategy that has been effective for other meme coins like Dogecoin.
The presale is designed to encourage a wide range of investors by providing 95% of the token supply to the public, with a low initial cost of 100 $SHIBIE ($0.0167).
Shibie Coin’s post-presale strategy involves listing on Uniswap, a highly reputable decentralized exchange.
The team has reserved 10% of the total supply for subsequent listings on other centralized exchanges.
To ensure liquidity and smooth transactions, 2 billion tokens have been dedicated to the platform’s liquidity.
Q3 2023 will witness a concentrated effort to list $SHIBIE on multiple centralized exchanges.
Since meme tokens rely on extensive community involvement, the platform will also focus on extensive marketing across different platforms.
By drawing a parallel to the accomplished meme projects such as Pepe Coin, Shibie Coin is utilizing its connection to the revered Barbie character and the Shiba Inu doge token to make a name for itself.
To keep potential investors updated, a Telegram channel with artificial intelligence capabilities has been set up.
Disclaimer: Crypto is a high-risk asset class. This article is provided for informational purposes and does not constitute investment advice. You could lose all of your capital.